
Luca Rapisarda on assessing threats to archaeological sites using remote sensing and statistical modelling
Regardless of scale, decision-making for cultural heritage presents challenges linked to threat management. Natural and anthropogenic processes may be harmful to the various features of such sites. Furthermore, different areas of the archaeological landscape may be affected more or less intensely by the same processes. Illustrating the impact and locations of the threats to archaeology in a given region is of vital importance to enabling prioritisation connected to the study and protection of the sites. The Lebap region has been selected as a test area – using a dataset of 349 features detected via remote sensing – for the development of a replicable methodology aimed at the creation of actionable maps which demonstrate observable threats to sites.

Lebap is the easternmost of the five administrative regions in modern Turkmenistan. Historically, it encompassed several oases along the Āmū Daryā, where the river released its sediments creating a fertile environment 15 km wide on average. The landscape is otherwise predominantly desert-like, with the deserts Karakum in the west, and Kyzylkum in the east (Figure 1). In the northern oasis thrived Āmul (modern Turkmenabat), a city-fortress at the crossroads on the Silk Roads. Āmul also gives the name to the Āmū Daryā. Now, Turkmenabat is the second city for population and industrial significance in the country (Burkhanov 2008).
‘The early development of cultures has always been linked to specific technologies to use natural resources. It requires learning from the nature, how to exploit a resource the best way, and to know the best moment to use them’ (Wantzen et al. 2016, 8) where the river was a source of fresh water and food, whilst wide floodplains supported human activities related to agriculture and livestock. The Āmū Daryā has been both a means of communication with neighbouring cultures and a natural barrier against enemy attacks. Widespread archaeological remains testify early habitation of the region, with outstanding examples of human interaction with the landscape dated as far back as the Kushan period (1st – 4th centuries) (Burkhanov 2009).

Step 1. Developing a methodology

Nine defined threats which are observable through remote sensing (this methodology does not factor in ground observations) were used in this study in order to assess levels of risk to the sites.
anthropogenic threats
urban encroachment
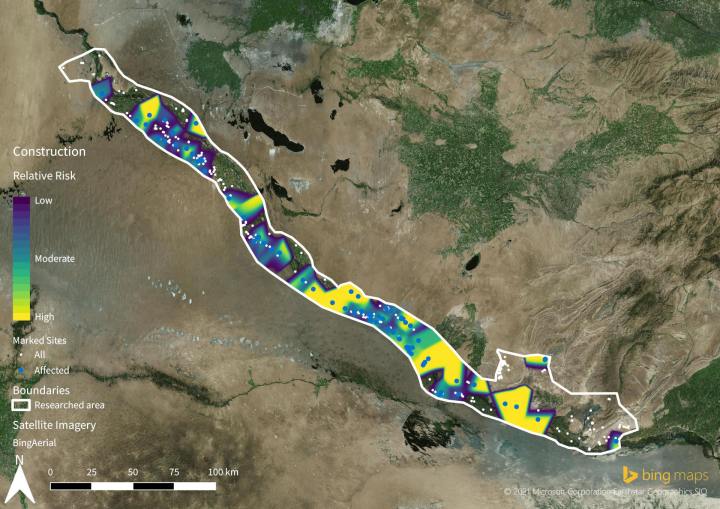
construction
agriculture
quarrying
looting
fire
dumping
natural processes
riverine
soil erosion
One of the limitations of this methodology is the complete reliance on the remote sensing process, effectively the risk assessment is carried out analysing satellite images only. This is also reflected in the selection of the threats analysed, the impacts of which can be detected remotely. Where the satellite images do not provide enough data to determine if a particular threat is acting on the archaeology or not (‘no clear data’), a value of 0 has been given. For the vast majority of features, the impact of the threats was defined on a scale of 1 (No Risk) to 5 (Very High), depending on the likelihood and consequence of the threat. Determining the possible impact of a given threat on an archaeological site relying exclusively on satellite imagery is challenging, therefore, to increase the accuracy of the dataset, a diverse range of images has been utilised. With the support of Bing Aerial, ESRI, and Google Earth, it has been possible to examine images taken at different moments in time, highlighting seasonal variations, or abrupt changes to the landscape. The declassified CORONA images (taken from 1960-1972) added the opportunity to investigate long term phenomena such as urban expansion and river changes.
Step 2. Employing a statistical model
In order to obtain a reliable model, identification of the threats and assignment of the level of risk has to be carried out with the greatest accuracy possible. For the Lebap region, the spatial distribution of the archaeological features (Figure 2 above) affected by the above-mentioned threats has been analysed in search of statistical uniformity (Figure 4 slideshow below shows the the risk assessment by threat). The statistical tools employed in this phase of the research are known as relative risk surfaces (Bevan 2020), generated by calculating the ratio of two probability density functions. Each relative risk surface is assessed by threat, and it has been produced through a case-controlled approach where the affected features are compared to the totality of the archaeological sites detected. The resulting distribution interpolates the values between the detected features, describing the risk likelihood in a scale from low (0) to high (100).
The relative risk surfaces have been generated developing a basic script in R environment. A kernel density estimation (KDE) is run as a density function for the totality of the dataset, representing the divisor of the ratio constituting the relative risk surfaces. KDEs are also produced for each threat, depicting the density distribution of the affected features, which represents the dividend of the aforesaid ratio. KDEs assess the density of the point pattern, each point being a feature, interpolating as a continuous surface the areas where the points aggregate in clusters. In a GIS framework, the resulting relative risk surfaces can be visualised as raster layers, where every cell presents a risk value comprised between 0 and 100, which can be also expressed in percentage (Figure 5).
Relative risk surfaces improve the perspective offered by a simple density function, since the risk distribution is defined by the archaeological features detected, rather than the general landscape. It also means that relative risk surfaces allow the detection of spatial patterns even when the dataset is relatively incomplete, or sub-divided by different feature typologies (Bevan 2012).
Descriptive models such as the relative risk surfaces may be used by local heritage professionals in the decision-making process, indicating which agents of change are more likely to act in a determined area, and how deep the impact could be, proving to be an extremely useful and effective tool for the preservation of cultural heritage, given the potential in aiding prioritisation of site intervention in the high-risk areas (Verhagen and Whitley 2012). The use of descriptive models in conjunction with landscape risk models (e.g. hydrology, seismology, urban expansion rate, etc.) may provide a significant overview of the threats acting on a specific study region (see Agapiou et al. 2015).
Figure 4 images depict a risk assessment according to the kinds of threats visible through remote sensing and figure 5 below shows the relative risk surface model in action: describing where the risk level may be detected in features not yet documented


Step 3. Creating maps which incorporate the relative risk surface model
The final step of the methodology (see Figure 3 above) is the generation of a map incorporating all the relative risk surfaces. A weight is assigned to each surface, according to the risk level by threat on the archaeological landscape. The result is an overall risk assessment map (Figure 6), a visual summary of the impact of the nine threats analysed, through the implementation of five risk zones (Low to Very High), depicting the areas where the combined action of multiple threats exerts the heaviest influence on the archaeological sites.
In this case, the weights have been assigned following a qualitative approach, rather than a mathematical function. Higher weights have been assigned to the threats more likely to generate catastrophic impacts on the archaeological sites of the Lebap region.
By analysing the trends of the risk assessment histograms (Figure 4), it is possible to determine which threats are more likely to cause irreversible damage to archaeology, and consequently assign the weights. An interesting exception is given by the soil erosion threat, since it affects the archaeological features depending on their typology, rather than geographical location.
Possible correlations between different threats (e.g. urban encroachment and construction) should also be taken into consideration during the weight-assigning process, in order to avoid bias constituted by overrepresenting certain categories of threats. The overall risk assessment map can also be amended to highlight different combinations of threats, changing the weights of the risk surfaces. Under the current parameters, a rapid analysis of the map reveals that six sites sit on a high to very high-risk area (2% of the total), whilst 76 sites are located in a moderate risk area (22% of the total).
This methodology has good potential for the identification and preservation of cultural heritage under threat. One of the significant strengths is replicability, both within and outside the CAAL project, since any parameters may be added or edited, to better represent different environments and study areas. Furthermore, from this methodology it is possible to proceed towards additional analyses, which may be undertaken with the intention of clarifying specific issues affecting the study area, or cross-validate the risk assessment.

- The methodology discussed in this article is based on Luca Rapisarda‘s MA dissertation in Managing Archaeological Sites at the UCL Institute of Archaeology.
references
Agapiou, A. et al. 2015. “Cultural heritage management and monitoring using remote sensing data and GIS: The case study of Paphos area, Cyprus”. Computers, Environment and Urban Systems 54: 230–239. https://doi.org/10.1016/j.compenvurbsys.2015.09.003
Bevan, A. H. 2012. “Spatial methods for analysing large-scale artefact inventories”. Antiquity 86(332):492-506. https://doi.org/10.1017/S0003598X0006289X
Bevan, A. H. 2020. “Spatial Point Patterns and Processes”. In Archaeological Spatial Analysis: A Methodological Guide, edited by M. Gillings, P. Hacigüzeller, and G. Lock, 60–76. London: Routledge.
Burkhanov, A. A. 2008. Амуль-Чарджуй на трассе Великого Шёлкового пути (краткий историко-археологический очерк развития столичного центра Лебапского региона). Текст научной статьи по специальности «История и археология». “Amul-Chardzhou on the route of the Great Silk Road”. Bulletin of Altai State University, History and Archaeology: Barnaul. Available from: https://cyberleninka.ru/article/n/amul-chardzhuy-na-trasse-velikogo-shyolkovogo-puti-kratkiy-istoriko-arheologicheskiy-ocherk-razvitiya-stolichnogo-tsentra-lebapskogo/viewer
Burkhanov, A. A. 2009. Архитектура и строительное дело Лебапского региона (по материалам изучения поселений древнего и раннесредневекового времени Средней Амударьи). Текст научной статьи по специальности «История и археология». “The Lebap region during the Middle Ages, historical-archaeological sketch about the coast of the Amu-Darya middle current”. Bulletin of Altai State University, History and Archaeology: Barnaul. Available from: http://izvestia.asu.ru/2009/4-3/hist/TheNewsOfASU-2009-4-3-hist-09.pdf
Verhagen, P. and T.G. Whitley. 2012. “Integrating Archaeological Theory and Predictive Modelling: a Live Report from the Scene”. Journal of Archaeological Method and Theory 19:49-100. https://doi.org/10.1007/s10816-011-9102-7
Wantzen, Karl, et al. 2016. “River Culture: An eco-social approach to mitigate the biological and cultural diversity crisis in riverscapes”. Ecohydrology & Hydrobiology. 16(1):7-18. https://doi.org/10.1016/j.ecohyd.2015.12.003